How to Read Candlestick Patterns for Beginners

“This post may contain affiliate links. If you use these links to buy something we may earn a commission but you may gain some knowledge.”
History of Candlestick Charts
Candlestick patterns were originally created by the Japanese in the 1700’s. They were originally used as receipts for rice trading warehouses. These receipts also represented the first futures contracts.
They are referred to as candlestick charts because of the way that they represent the information they provide. These charts provide a visual representation of the opening, high, low and closing prices of the period of time they are representing.
What Can A Candlestick Pattern Tell Us?
Candlestick patterns were mostly unknown to the western world until the 1980’s. These charts not only provide the prices, but they also represent the underlying psychology of the current market as well.
Candle charts represent the same information as traditional western charts but they make it much easier to see the underlying prices more clearly in the same amount of space.
How to Read a Candlestick
What we are looking at in a candlestick are the opening price, high price, low price and closing price for the day. We can also see if the price rose or dropped that day.
These charts show price action and the length and direction of the shadow can give us an indication as to the future price of the market.
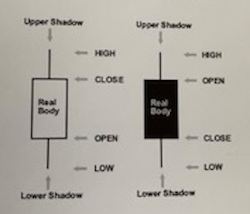
The shadow, or wick, will extend above or below the real body depending on the relation to the open and closed price. The length and direction of the wick can be an indication of the future price.
The real body is the part of the candlestick that is either open or shaded and represents the high and low for the day. If the chart is open, then the price closed higher than it opened for that day. If the real body is shaded in, then the price closed lower than it opened that day.
The length of the body can tell a lot about the psychology of the traders that day. A long, shaded box indicates a bearish market as it shows a large drop between opening and closing price where a small shaded box represents indecision as the price closed close to the opening price.
Statistics have shown us that reading candlestick charts can show us what the future of the market is going to do within a certain amount of accuracy. There are hundreds of patterns out there that people will study and trade because that pattern lets them know what the price is going to do.
Develop Your Trading Strategy
Studying and recognizing candlestick patterns is the first step to understanding future price action and developing your own strategy. My suggestion is to pick a couple of the more reliable and predictable patterns and learn everything you can about them and branch out from there.
These are not all of the candlestick patterns that exist, but these are a few of my favorites and great ones to start with.
Inverted Hammer
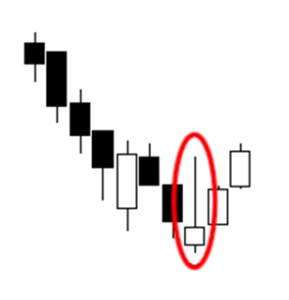
This pattern is a bullish reversal and forms at the end of a downturn. The price opens at or very near the low of the session and rises throughout the day before falling back near the opening price.
The volume leading up to this pattern will be above average during the formation of the pattern and as the price closes the next day will exceed in price.
Abandoned Baby
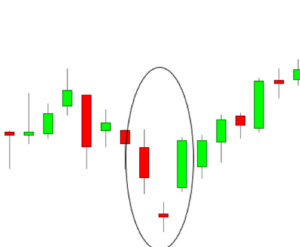
The abandoned Baby is a bullish reversal pattern that forms at the end of a downturn. It begins with a closed candle, the next candle gaps down with no overlap of the shadow of the previous day and forms a Doji.
The next candle gaps up higher on the open and closes above the previous day’s low.
The volume for this pattern will be above average throughout the pattern and will increase on the breakout.
You may begin to think that you only need to study bullish patterns, but it is equally important to study bearish patterns that will give you an indication of a time to sell when you start to see them form.
Here are a few of the top patterns you can look into a little further.
Bullish Patterns
Meeting Lines (Bullish)
Side-By-Side White Lines (Bullish)
Three Inside Up
Three Outside Up
Three White Soldiers
Thrusting
Tri-Star (Bullish)
Tweezers Bottom
Upside Tasuki Gap
Bearish Patterns
Abandoned Baby
Below the Stomach
Belt Hold (Bearish)
Dark Cloud Cover
Doji (Gravestone)
Downside Tasuki Gap
Engulfing
Evening Star
Falling Window
Hanging Man
In Neck
On Neck
Separating Lines (Bearish)
Shooting Star
Side-By-Side White Lines (Bearish)
Stick Sandwich
Three Black Crows
Three Inside Down
Three Outside Down
Tweezers Top
Upside Gap Two Crows